

Agent Observability: Designing Systems You Can Debug, Trust, and Improve

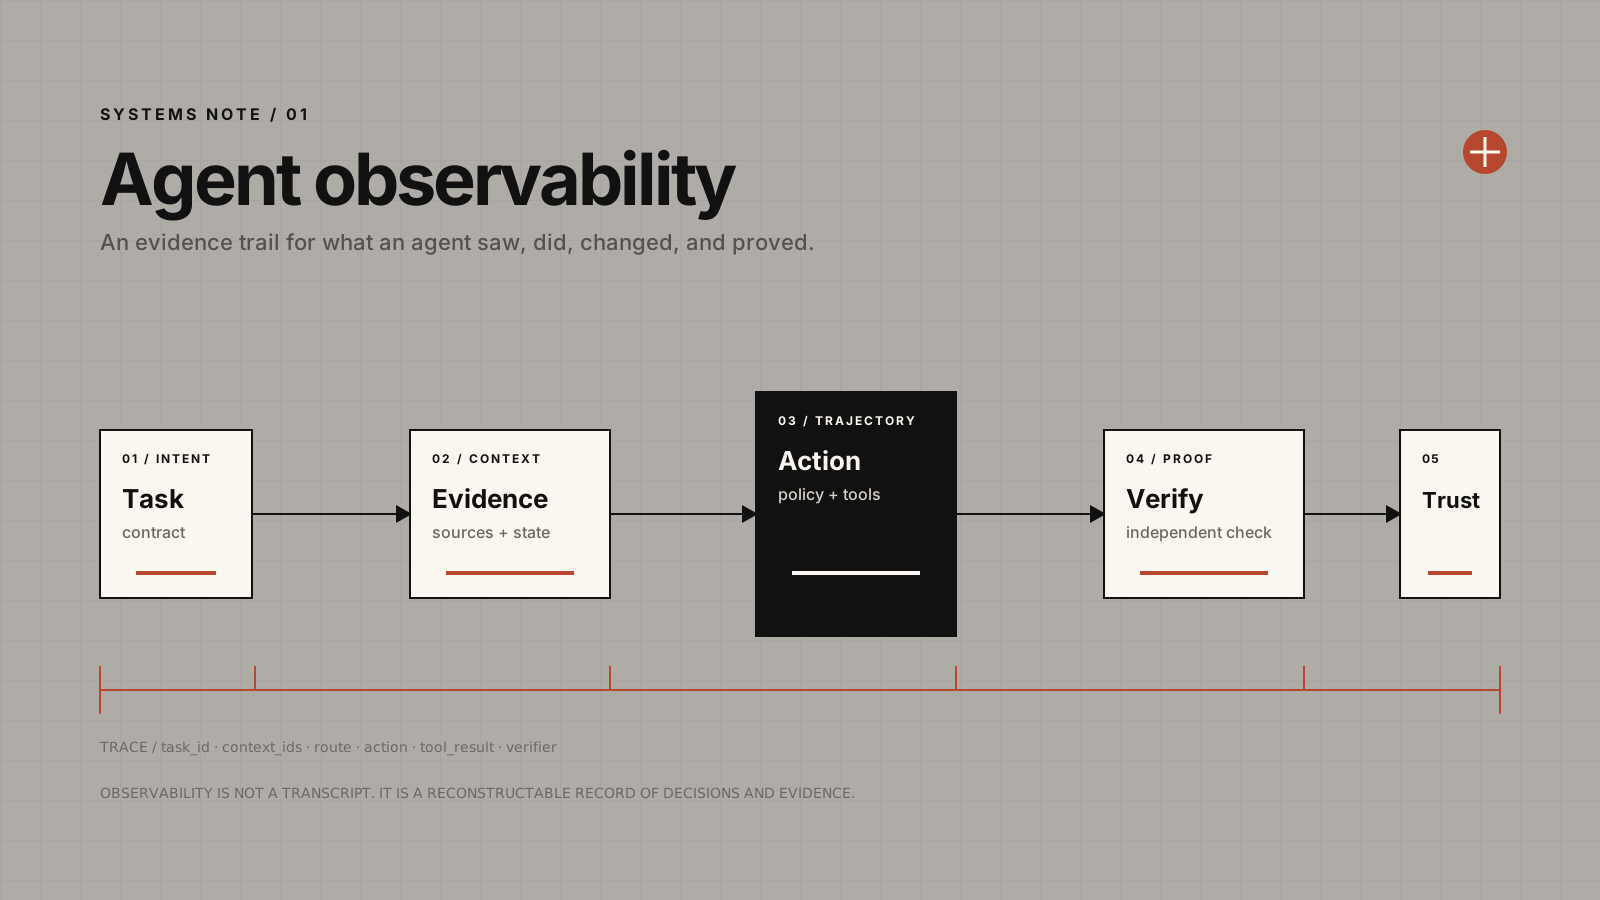 An evidence trail for what an agent saw, did, changed, and proved
An agent says it fixed the issue. The API returned 200. No exception was thrown. The dashboard says latency is normal.
But did it fix the issue? Which source did it trust? Which tool did it call? Did it repeat a failed action three times? Did it change a record, run the test it claimed to run, or merely produce a convincing sentence about the work?
Those are observability questions.
Agent observability is the discipline of producing enough evidence to reconstruct and assess autonomous work: the task an agent received, the state it saw, the decisions and tool calls it made, the results it observed, the side effects it caused, and the proof required to accept the outcome.
It is not a transcript by another name. It is not a collection of token charts. And it is not an invitation to record private reasoning. It is an engineering record that lets an operator answer four questions: what happened, why did it happen, was it acceptable, and what should change next?
This is the operating layer that follows harness, loop, and graph engineering. A harness constrains one run. A loop makes a unit of work converge. A graph coordinates several units of work. Observability makes the resulting system inspectable after it has met a real environment.
1. Healthy Infrastructure Can Still Produce a Bad Outcome🔗
Conventional observability asks whether a service is available, slow, or failing. Those are essential questions. An agent system still needs error rates, queue depth, database health, CPU saturation, and request latency.
They are not sufficient.
An agent can fail while all conventional service indicators are green. It may retrieve an obsolete policy, choose the wrong tool, overrun its budget in a retry cycle, or report a task complete without independent verification. The request may be fast, the tool call may be valid, and the final answer may sound excellent. The outcome can still be wrong.
| Conventional service observability | Agent observability |
|---|---|
| Did the service run? | Did the agent complete the job responsibly? |
| Request rate, errors, latency, CPU | Outcome, trajectory, evidence, side effects, and cost |
| A stack trace identifies failing code | A trace explains dynamic choices across models, tools, retrieval, and humans |
| Failure is often explicit | Failure can be plausible, unsafe, incomplete, or unverified |
| A request is usually the key unit | The key unit may be a run, end-to-end trace, or multi-turn thread |
OpenTelemetry makes the practical case: a slow or incorrect agent response may be caused by a model call, a tool call, a retry loop, or another step in the chain. Without a trace, an operator is guessing. Its GenAI conventions cover model calls, token use, finish reasons, tool calls, and tool results so these operations can be correlated with the rest of a system. OpenTelemetry’s GenAI observability guide
The important correction is that visibility into calls is the floor, not the destination. An observable agent must also expose whether the calls formed a responsible path to an accepted outcome.
2. The Units of Observation: Run, Trace, Thread, Outcome🔗
An agent system needs more than one level of explanation.
| Unit | What it contains | What it is useful for |
|---|---|---|
| Run | One model call, retrieval, tool invocation, policy check, evaluation, or approval | Debugging a local decision or dependency |
| Trace | The related runs for one attempt to complete a task | Explaining an end-to-end trajectory and side effects |
| Thread | A longer-lived user or workflow context containing multiple traces | Detecting lost context, stale memory, and repeated failures |
| Outcome | The accepted terminal state, evidence, verifier, and authority | Deciding whether work was actually complete |
A slow model response is a run-level issue. A coding agent that makes a valid sequence of calls but changes the wrong files is a trace-level issue. A support agent that gradually loses customer context across several interactions is a thread-level issue. A deployment that looks complete but lacks an approval record is an outcome-level issue.
The distinction prevents a common mistake: treating every production incident as a prompt problem. The failure may instead live in state selection, tool reliability, routing, permission enforcement, verification, or the absence of a real terminal-state contract.
3. Build an Evidence-First Trace🔗
The most useful trace is not the longest trace. It is the smallest durable record that can explain a consequential transition.
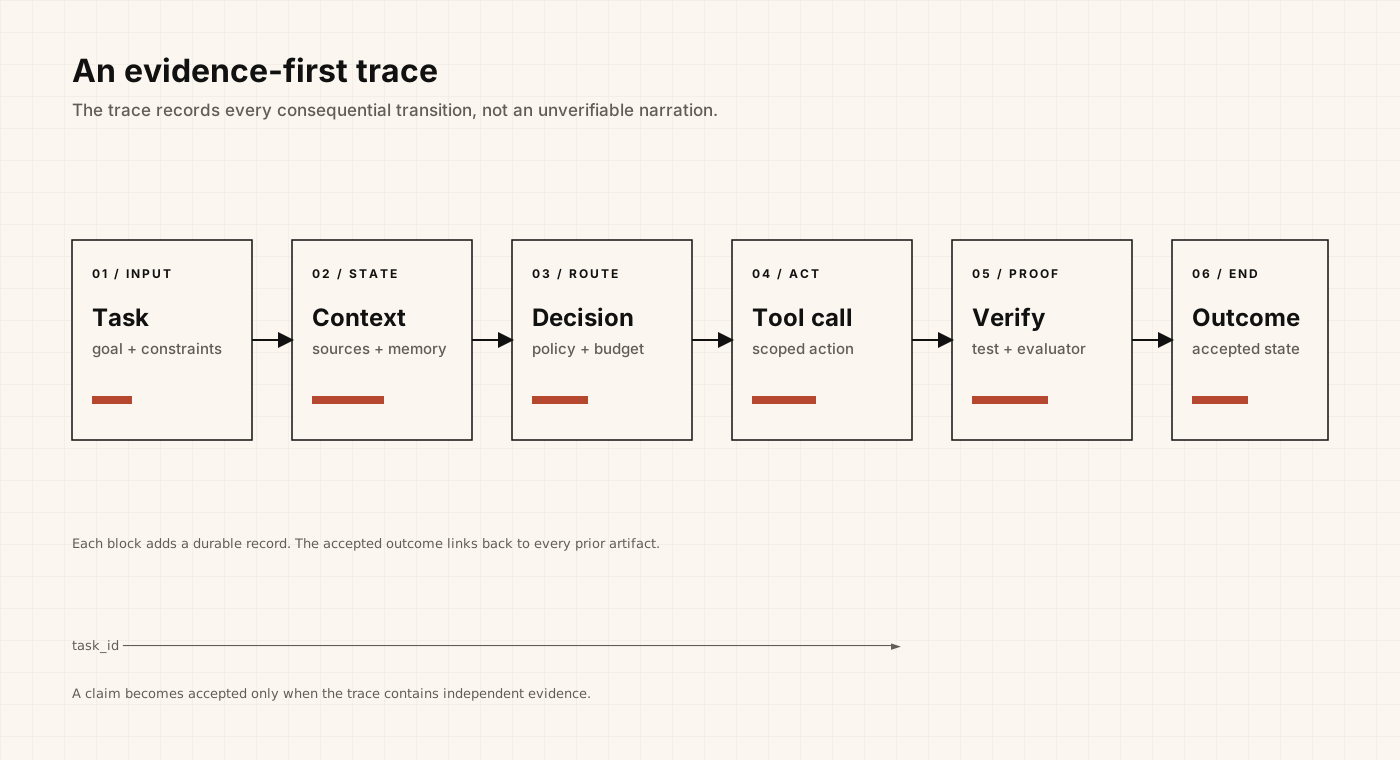 Six stages of an evidence-first trace, from task contract through verified outcome
Each trace should preserve the following kinds of evidence.
| Layer | Record | Why it matters |
|---|---|---|
| Identity | trace, thread, task, agent, model, tool, and policy versions | Makes behavior comparable and regressions attributable |
| Intent | normalized task contract, acceptance criteria, risk tier | Shows what the agent was actually meant to do |
| Context | source IDs, retrieval results, memory reads and writes | Explains the information that shaped the decision |
| Control | route, budget, retry reason, permission decision, escalation | Shows why the next transition was allowed |
| Action | validated tool arguments, scope, idempotency key, start/end time, result | Connects proposed activity to real side effects |
| Proof | tests, API responses, citations, evaluator output, reviewer decision | Separates an agent’s claim from evidence |
| Outcome | completed, blocked, needs review, rejected, or timed out | Ensures work has an explicit terminal state |
This produces a better record than a free-form narrative. Consider the difference:
Agent: “The CI issue is fixed.”
task: CI-1842
change: src/auth/token.ts
test: pnpm test auth/token -- 14 passed
integration suite: not run (missing database credential)
policy: merge not permitted without integration suite
terminal state: needs_review
The second record is useful to both a human operator and the next automated node. It preserves the remaining uncertainty instead of hiding it behind a completion claim.
4. Observe Decisions and Evidence, Not Private Reasoning🔗
Observability should not depend on retaining raw chain-of-thought or recording every conversation forever. That is neither necessary for operations nor a responsible default for systems that may process sensitive material.
The useful operational path is:
task contract → selected context → proposed action → policy decision
              → tool result → verification evidence → accepted outcome
This path explains behavior through observable artifacts. The operator can see that a retrieval source was stale, a schema check rejected the proposed action, or a test was never run. It does not pretend that an internal rationale is ground truth.
Content capture deserves special care. Tool arguments, tool results, prompts, retrieved documents, and user messages can contain credentials, personal data, proprietary code, or regulated records. OpenTelemetry’s GenAI attribute guidance explicitly marks tool-call arguments and results as potentially sensitive; content should be collected only when it has an operational purpose and the correct access, redaction, retention, and deletion controls exist. OpenTelemetry’s GenAI attribute registry
For many systems, structured metadata plus access-controlled evidence references are safer than copying full content into a second telemetry store.
5. Measure the Shape of Work, Not Only Its Cost🔗
Token counts and latency matter. They do not reveal whether the system is useful. The metric set should match the property being operated.
| Property | Measures worth tracking |
|---|---|
| Outcome quality | verified-task success, human acceptance, policy-violation rate, unsupported-claim rate |
| Path efficiency | tool calls per verified task, retry rate, repeated-observation rate, dead-end rate |
| Reliability | terminal-state coverage, timeouts, tool-failure rate, recovery success, escalation rate |
| Evidence quality | consequential actions independently verified, citation validity, stale-context incidence |
| Control | approval-gate coverage, denied-action rate, permission-boundary violations, audit completeness |
| Economics | cost per verified outcome, tokens per completed task, human-review minutes per accepted result |
| Drift | change in outcomes or trajectories by model, prompt, tool, policy, or agent version |
Cost per verified outcome is especially important. A workflow is not efficient merely because one model call is cheap. If it takes four retries, two evaluator calls, and thirty minutes of human repair to create an accepted result, that full cost belongs to the outcome.
6. Traces Become the Input to Evaluation🔗
Observability is not evaluation. A trace says what happened; an evaluation judges whether that was good enough. The two form one operating loop.
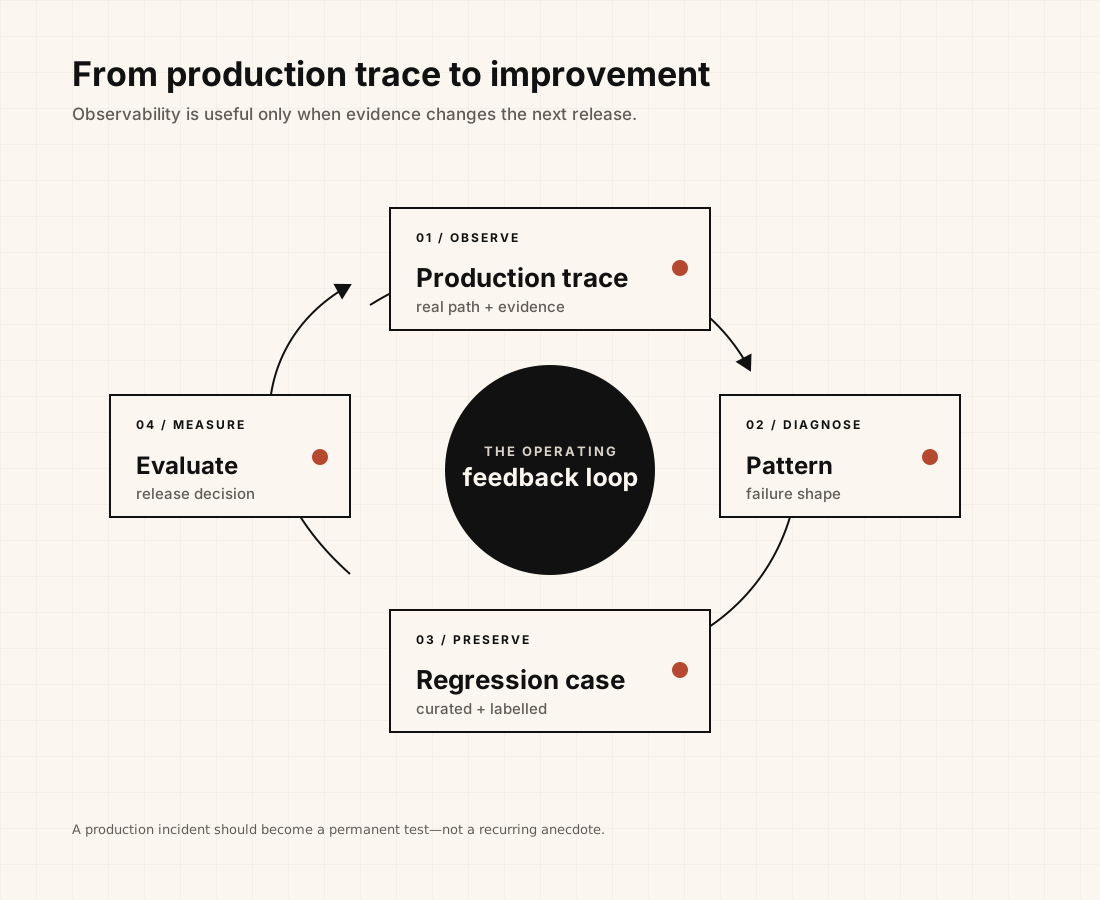 Production traces become failure patterns, regression cases, evaluations, and measured releases
Production matters because language inputs, retrieved context, and tool environments create failure modes that no small pre-launch test set can fully anticipate. The productive response is not to accept production failures as inevitable. It is to convert representative, privacy-safe traces into labelled cases and add them to the evaluation suite.
Anthropic describes the alternative clearly: once an agent is in production, teams without evaluations fall into a reactive loop of waiting for complaints, reproducing manually, applying a fix, and hoping another behavior did not regress. Anthropic’s guide to agent evaluations
The improvement loop is straightforward:
- Capture a trace for a sampled or consequential production task.
- Identify a failure pattern or an exemplary success path.
- Curate the minimum safe example: task, context references, expected constraints, and observed evidence.
- Add a deterministic check, human rubric, or calibrated evaluator.
- Make one targeted change to the prompt, tool, context policy, routing rule, or harness.
- Evaluate the change offline, then monitor it in a bounded release.
This is how a production trace becomes a regression test rather than a recurring anecdote.
7. A Concrete Failure: Everything Passed Except the Task🔗
Imagine a support agent asked to answer a customer’s question about an account migration.
The service layer is healthy. The model call succeeds. The search endpoint returns a document. The agent produces a clear answer in two seconds. Every infrastructure alert is green.
The trace reveals the actual failure:
- The task was classified as
migration-policy. - Retrieval returned a document from an older policy version.
- The agent selected it because the document had high lexical overlap with the customer’s wording.
- The response cited no policy version and ran no freshness check.
- A later human review rejected the answer.
This is not an availability incident. It is a context and verification failure.
The fix may be a metadata filter, a policy-version gate, a better retrieval contract, or an evaluator that checks whether an answer cites the active policy. It is unlikely to be solved reliably by adding “be accurate” to the prompt.
Anthropic reports a similar operational lesson from its multi-agent research system: production tracing helped distinguish poor search behavior, tool failures, and other dynamic failure causes. It also describes monitoring decision patterns and interaction structure without monitoring the contents of individual conversations—a useful privacy-preserving pattern. Anthropic
8. Design for the Operator Who Must Explain a Bad Run🔗
Every consequential trace should make these questions cheap to answer:
- What happened? Reconstruct the ordered timeline of runs and side effects.
- Why was each transition allowed? Show the task contract, evidence, routing, policy, and budget.
- What proves the result? Link claims to tests, external responses, citations, or a named human decision.
- What remains uncertain? Record skipped checks, unavailable dependencies, assumptions, and unresolved conflicts.
- Who owns the next decision? Name the service, agent, or human authority that can accept, retry, escalate, or discard the work.
If a system cannot answer these questions, it is not yet observable enough to be autonomous in a consequential environment.
9. Start Small: Instrument One Consequential Workflow🔗
Do not begin by capturing every token from every model call. Start with one workflow that has a material side effect or a repeated failure mode: preparing a code change, updating a support ticket, classifying a security finding, or generating a customer-facing recommendation.
For that workflow:
- assign a stable task and trace identity;
- store the acceptance criteria outside the model’s narrative;
- capture tool results and policy decisions as structured events;
- distinguish facts, proposals, and accepted state;
- require independent proof for consequential completion;
- sample content cautiously, with redaction and access controls; and
- turn one important production trace into an evaluation case.
OpenTelemetry semantic conventions are valuable here because common names for operations and attributes make telemetry easier to correlate across services, languages, and platforms. But agent-specific concepts—task contracts, evidence references, authority, terminal states, and acceptance criteria—remain application design decisions. OpenTelemetry semantic conventions
10. Observability Is How an Agent System Earns the Right to Improve🔗
Autonomy without an evidence trail turns every incident into a story someone has to reconstruct by hand. A dashboard may show that the model was fast; it cannot tell you whether the agent acted safely, used the correct context, or achieved a verifiable result.
Agent observability changes the standard. It asks systems to preserve the artifacts that matter: intent, state, decisions, actions, proof, and ownership.
That is not bureaucracy around the agent. It is the feedback channel that lets a harness recover, a loop converge, a graph coordinate, and an operator trust the result.
Further Reading🔗
- Inside the LLM Call: GenAI Observability with OpenTelemetry — practical GenAI traces, token metrics, and tool-call telemetry.
- Agent observability powers agent evaluation — a useful run, trace, and thread framing for turning production behavior into evaluation cases.
- Demystifying evals for AI agents — why production agent systems need systematic evaluation rather than reactive debugging.
- How we built our multi-agent research system — production tracing, dynamic agent failure modes, and privacy-aware high-level monitoring.